A current liability is any debt that must be paid in the current fiscal period. If you begin a new management technique, such as Balanced Scorecard, you are not just investing the money required to hire trainers and have a couple of offsite instruction sessions, you are committing to pursue the effort into the future. That commitment is a current liability.
In the previous post, I argued that from a scheduling point of view, running multiple process improvement programs at the same time was counter-productive. I think you could make a similar argument from a financial perspective.
Assume you have 6 VPs or division heads and 1 CEO. Assume each has a staff that costs 3 times that and a workforce that costs 10 times that. They all decide to start a new process improvement program, let’s call it Categorical Asset Tracking (CAT).
You knew I’d get cats into this post somehow, didn’t you?
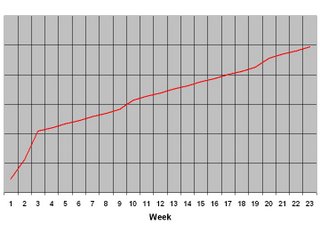
The following chart shows the qualitative, cumulative costs of CAT as a function of time. In week 1, the VPs and CEO go to training. The cost is training plus their time. In week two, their staffs get trained. In week three, there’s the company-wide employee rollout of CAT. Starting in week four, you begin to have people devoted full-time to the implementation of CAT.
Think I’m joking? Check out Lean Six Sigma. It requires an army of people to implement.
Every other week, the VPs and CEO devote part of their meetings to discussing CAT. Every 8 weeks, each employee devotes some time to CAT.

When I started working this out for one example for my organization, the numbers became cosmic. The costs seemed unreal, so I removed the dollar values and went with the qualitative graph instead. You just would not have believed it.
Layer four to six of these on top of one another, staggered in time over several years, and you get an absolutely back-breaking cost.
To be continued…
Technorati tags: management accounting profit process improvement business
No comments:
Post a Comment